Standard Deviation and Standard Error of the Mean: Difference between revisions
(Created page with "{{Stub}} See open access article by Lee and colleagues.<ref>Lee DK, In J, Lee S. Standard deviation and standard error of the mean. Korean J Anesthesiol. 2015 Jun;68(3):220-3...") |
No edit summary |
||
| Line 1: | Line 1: | ||
{{Stub}} | {{Stub}} | ||
See open access | '''The Standard Error of Mean''' (SEM) quantifies uncertainty in estimate of the mean. The '''Standard Deviation''' (SD) indicates dispersion of the data from the mean. | ||
Studies are often done on samples of a population, and the data is summarised using ''descriptive statistics''. These findings are then generalised to the larger unstudied population using ''inferential statistics''. | |||
== Standard Deviation == | |||
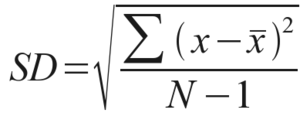
[[File:Standard deviation.png|thumb|SD = standard deviation, X = individual value, X̄ = sample mean, n = sample size]] | |||
The findings of a sample with a normal distribution can be described by mean and SD. The sample mean is denoted by X̄ which is the centre of distribution. SD is the dispersion of individual observations about the mean. It is the typical distance of an observation from the distribution centre or middle value. A low SD means less variability, while a high SD means more variability with the data being more spread out. | |||
The sample results are used to make inferences regarding the population. The sample mean (X̄) estimates the true but unknown population mean (μ). While the sample SD (σ) estimates the population SD (s). Different samples may come up with different estimates of the population mean. | |||
"''Standard Deviation is the dispersion of individual observations about the mean''" | |||
SD helps to visualise the effect size, i.e. the difference between groups. This helps to differentiate between statistical significance and clinical significance. Effect size is determined by calculating the difference between the means divided by the pooled or average SD from two groups. An effect size of 0.8 or more is a large effect, meaning that the two groups are separated by 0.8SD. An effect size of 0.5 is moderate, and 0.2 is small. | |||
== Standard Error of Mean == | |||
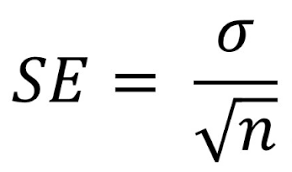
[[File:SEM.png|thumb|SE = standard error of mean, σ = SD of sample, n = sample size]] | |||
If you take different samples of individuals and plot each individual sample mean, then you find that these sample means are also normally distributed. The mean of these samples is the mean of the original population. The standard deviation of these sample means is the SEM. | |||
"''Standard Error of Mean is the standard deviation of mean of random samples drawn from the original population''" | |||
SEM is a measure of the precision with which sample mean (X̄) estimates the population mean (μ). The precision increases with increased sample size. It quantifies uncertainty in the estimate of the mean. | |||
The main purpose of SEM is to construct confidence intervals (CI), which is the range of values believed to contain the actual true population value. This value isn't known usually but can be estimated from an appropriate sample. Wider CIs mean less precision; narrow CIs mean greater precision. | |||
== Comparison == | |||
* SD estimates the variability of observations. | |||
* SEM estimates the variability of possible values of means of samples. | |||
* SEM is expected to have less variability than SD, because mean values are considered for its calculation. | |||
Many published articles misuse these terms by using SEM instead of SD to express variability of data, because it typically is a smaller number and so "looks better". Readers are usually more interested in knowing the variability within the sample, and not the proximity of the mean to the population mean. Therefore data should be summarised with SD and not SEM. | |||
Readers can use reported SD values by knowing that 95% of the population fall within 2 standard deviations of the mean in a normal distribution. | |||
Readers can also use SD values to determine effect sizes. SEM values cannot help with this. | |||
== Resources == | |||
See open access articles by Lee and colleagues.<ref>Lee DK, In J, Lee S. Standard deviation and standard error of the mean. Korean J Anesthesiol. 2015 Jun;68(3):220-3. doi: 10.4097/kjae.2015.68.3.220. Epub 2015 May 28. PMID: 26045923; PMCID: PMC4452664.</ref> and Barde<ref>Barde MP, Barde PJ. What to use to express the variability of data: Standard deviation or standard error of mean? Perspect Clin Res. 2012 Jul;3(3):113-6. doi: 10.4103/2229-3485.100662. PMID: 23125963; PMCID: PMC3487226.</ref> | |||
== References == | == References == | ||
[[Category:Statistics]] | [[Category:Statistics]] | ||
Revision as of 13:05, 11 September 2021
The Standard Error of Mean (SEM) quantifies uncertainty in estimate of the mean. The Standard Deviation (SD) indicates dispersion of the data from the mean.
Studies are often done on samples of a population, and the data is summarised using descriptive statistics. These findings are then generalised to the larger unstudied population using inferential statistics.
Standard Deviation
The findings of a sample with a normal distribution can be described by mean and SD. The sample mean is denoted by X̄ which is the centre of distribution. SD is the dispersion of individual observations about the mean. It is the typical distance of an observation from the distribution centre or middle value. A low SD means less variability, while a high SD means more variability with the data being more spread out.
The sample results are used to make inferences regarding the population. The sample mean (X̄) estimates the true but unknown population mean (μ). While the sample SD (σ) estimates the population SD (s). Different samples may come up with different estimates of the population mean.
"Standard Deviation is the dispersion of individual observations about the mean"
SD helps to visualise the effect size, i.e. the difference between groups. This helps to differentiate between statistical significance and clinical significance. Effect size is determined by calculating the difference between the means divided by the pooled or average SD from two groups. An effect size of 0.8 or more is a large effect, meaning that the two groups are separated by 0.8SD. An effect size of 0.5 is moderate, and 0.2 is small.
Standard Error of Mean
If you take different samples of individuals and plot each individual sample mean, then you find that these sample means are also normally distributed. The mean of these samples is the mean of the original population. The standard deviation of these sample means is the SEM.
"Standard Error of Mean is the standard deviation of mean of random samples drawn from the original population"
SEM is a measure of the precision with which sample mean (X̄) estimates the population mean (μ). The precision increases with increased sample size. It quantifies uncertainty in the estimate of the mean.
The main purpose of SEM is to construct confidence intervals (CI), which is the range of values believed to contain the actual true population value. This value isn't known usually but can be estimated from an appropriate sample. Wider CIs mean less precision; narrow CIs mean greater precision.
Comparison
- SD estimates the variability of observations.
- SEM estimates the variability of possible values of means of samples.
- SEM is expected to have less variability than SD, because mean values are considered for its calculation.
Many published articles misuse these terms by using SEM instead of SD to express variability of data, because it typically is a smaller number and so "looks better". Readers are usually more interested in knowing the variability within the sample, and not the proximity of the mean to the population mean. Therefore data should be summarised with SD and not SEM.
Readers can use reported SD values by knowing that 95% of the population fall within 2 standard deviations of the mean in a normal distribution.
Readers can also use SD values to determine effect sizes. SEM values cannot help with this.
Resources
See open access articles by Lee and colleagues.[1] and Barde[2]
References
- ↑ Lee DK, In J, Lee S. Standard deviation and standard error of the mean. Korean J Anesthesiol. 2015 Jun;68(3):220-3. doi: 10.4097/kjae.2015.68.3.220. Epub 2015 May 28. PMID: 26045923; PMCID: PMC4452664.
- ↑ Barde MP, Barde PJ. What to use to express the variability of data: Standard deviation or standard error of mean? Perspect Clin Res. 2012 Jul;3(3):113-6. doi: 10.4103/2229-3485.100662. PMID: 23125963; PMCID: PMC3487226.


